Running ThreatGet
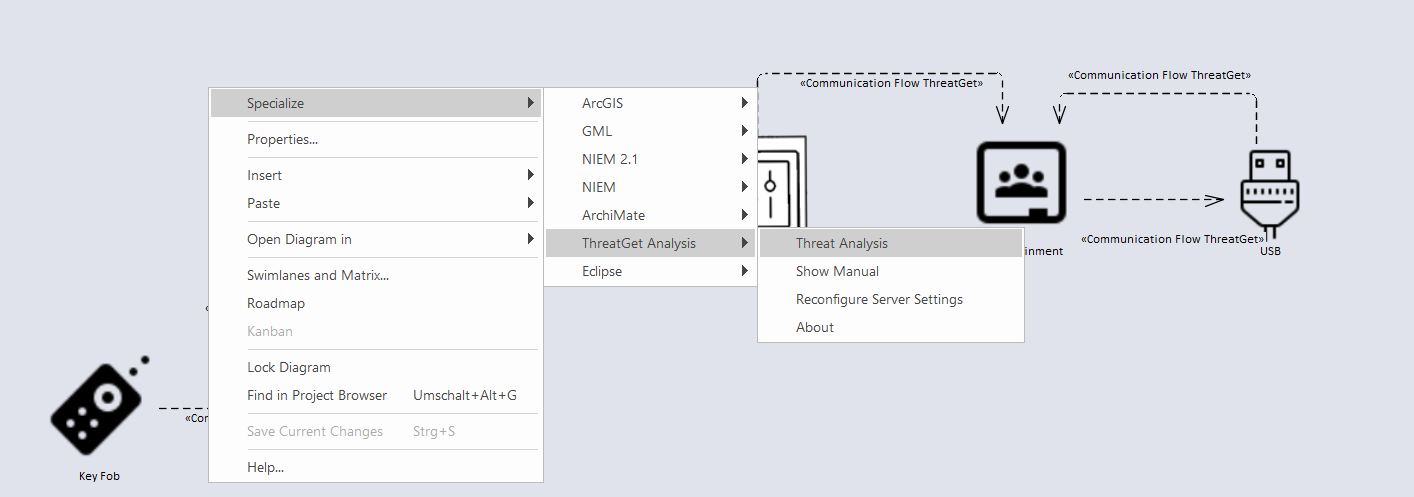
To demonstrate the ThreatGet operation, use the default ThreatGet Diagram with Example or the model example. In the Project Browser, right-click either on the package or the diagram itself and then select Specialize ➺ ThreatGet Analysis ➺ Threat Analysis. In our case, the package is called ThreatGet Example.
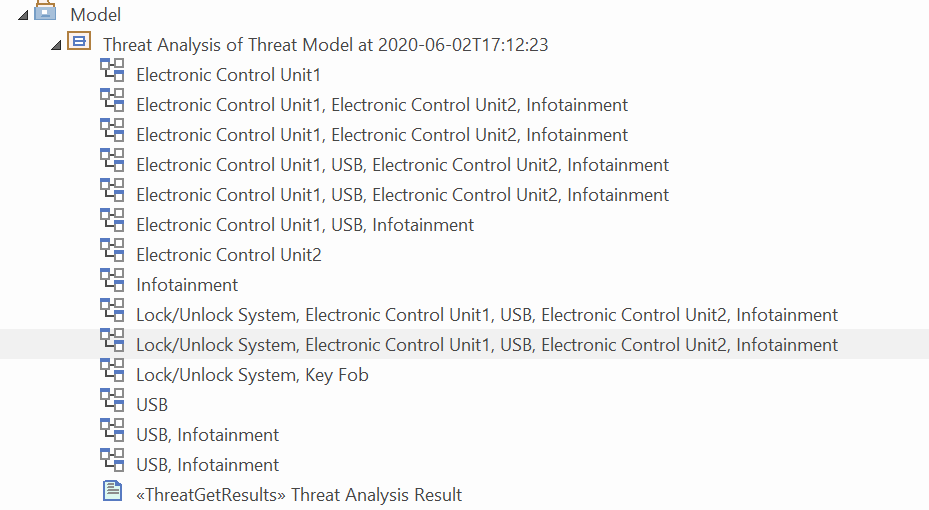
The Threat Analysis creates a new package where analysis details are stored. It is visible in the Project Browser and can be deleted when it is no longer needed. Further, a new tab titled Threat Analysis is opened.
Threat Analysis generates a list of all the potential threats of overall affected elements in the given example model, as shown below.
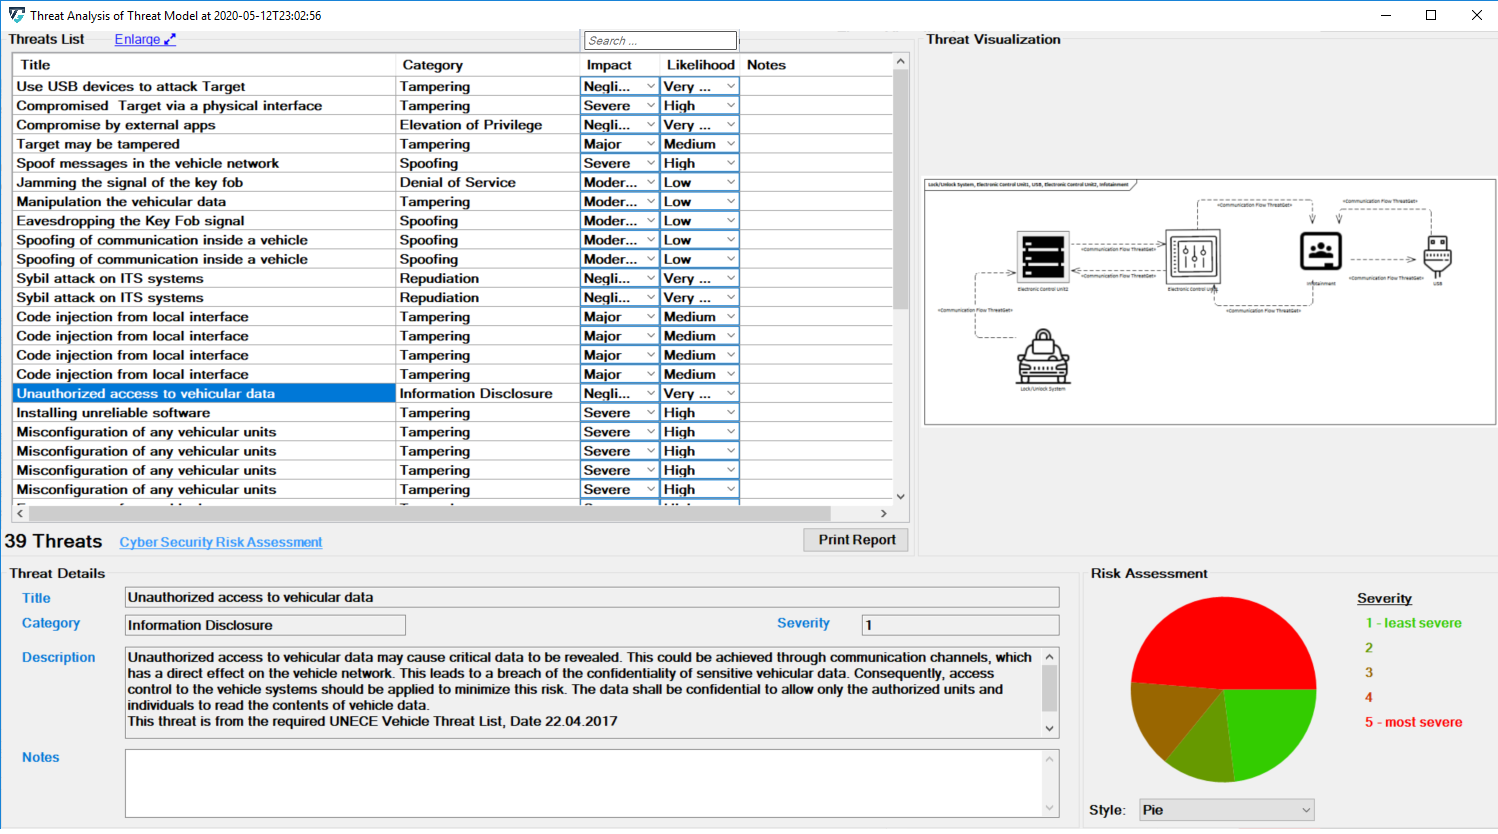
Scroll in the Threat List table to reveal Impact and Likelihood values. On the right side, there is a diagram that depicting the selected threat. If several threats are detected on the same elements, they are all in the diagram. All related details for each identifiedthreat can be viewed at the bottom section represented as Threat Details.
Each Threat is categorized based on the STRIDE model:
- S – Spoofing of user identity
- T – Tampering
- R – Repudiation
- I – Information Disclosure
- D – Denial of Service
- E – Elevation of Privilege
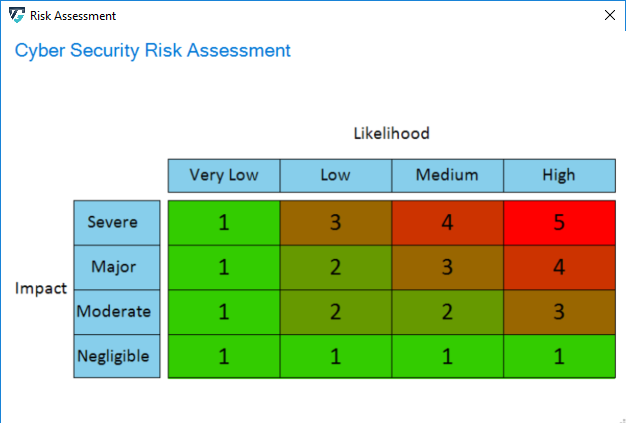
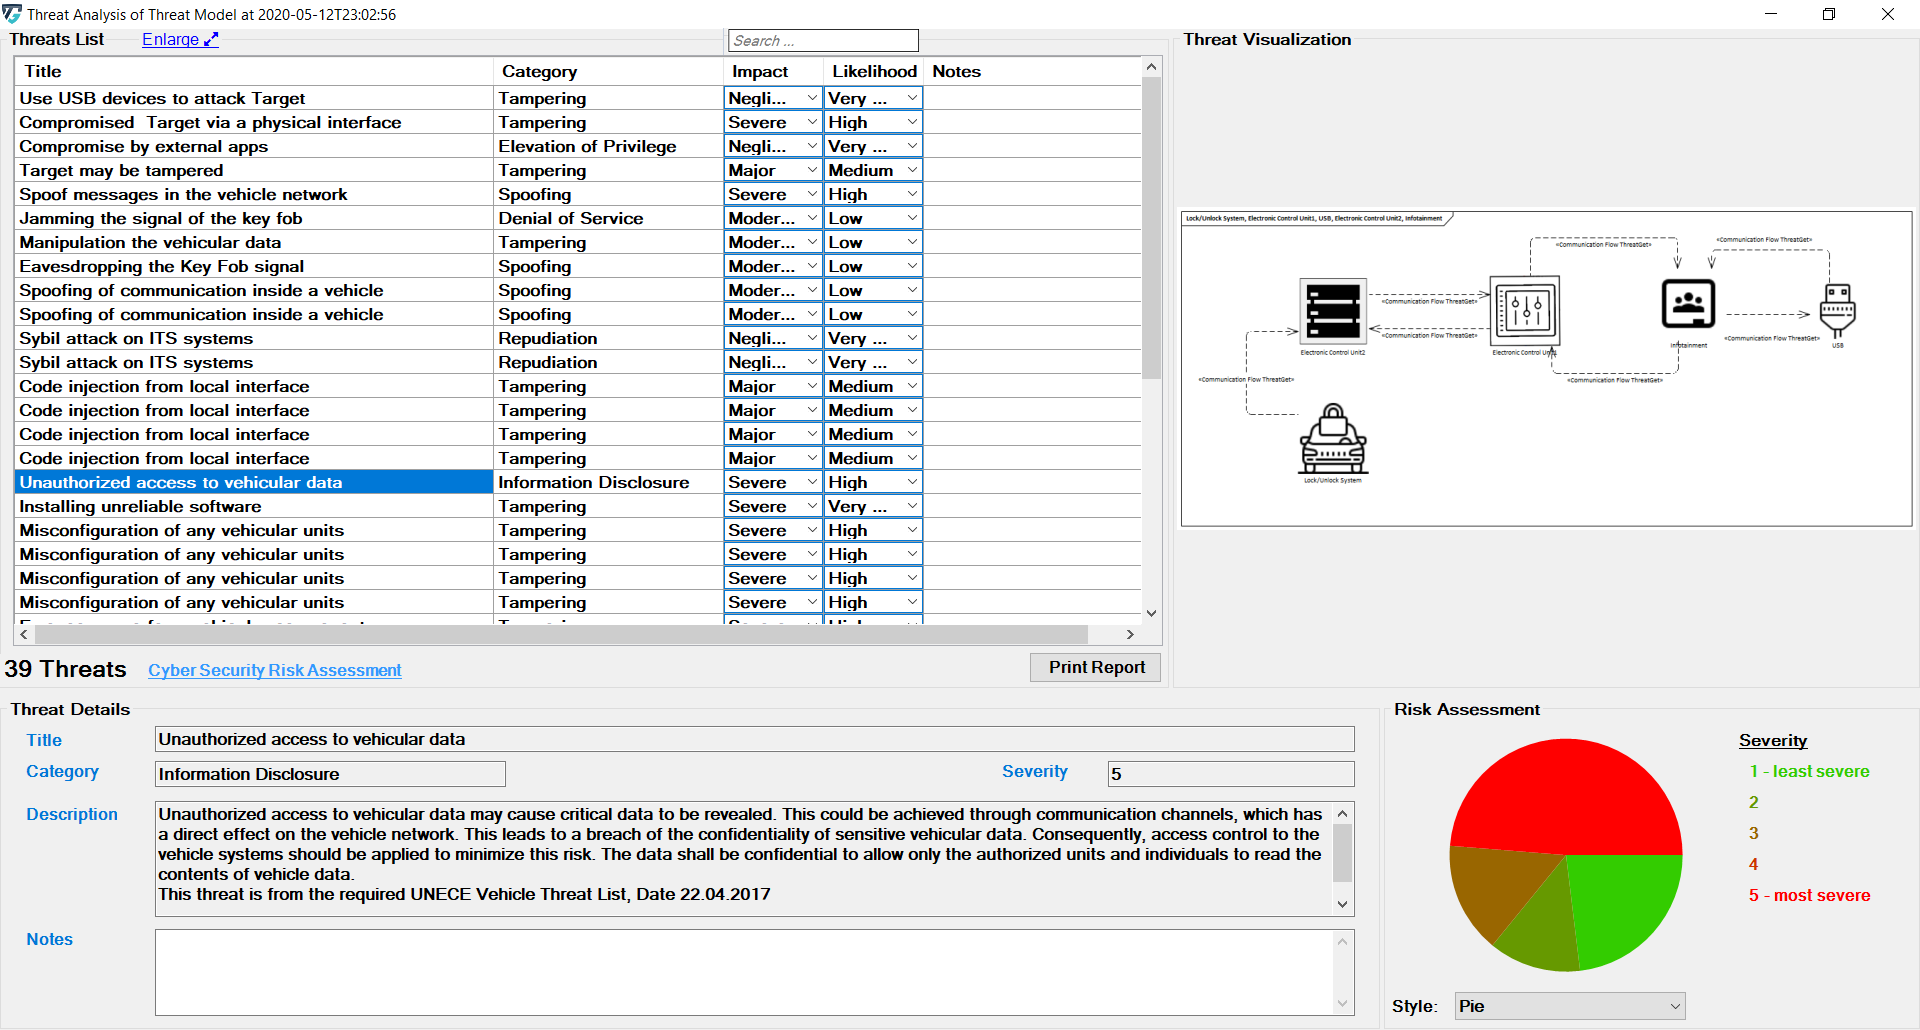
Each Threat is further annotated with two additional parameters, Impact and Likelihood. From these values the risk severity is calculated which is required for the corresponding Risk Assessment as shown below.
The Likelihood and Impact values are determined by the rules as described in Managing Rules. On the EA plugin interface, the user can adjust these values by selecting newly adapted values from drop-down menus.
The values of Impact, Likelihood, and the risk evaluation process are defined on the ThreatGet server as discussed in Risk Matrix.
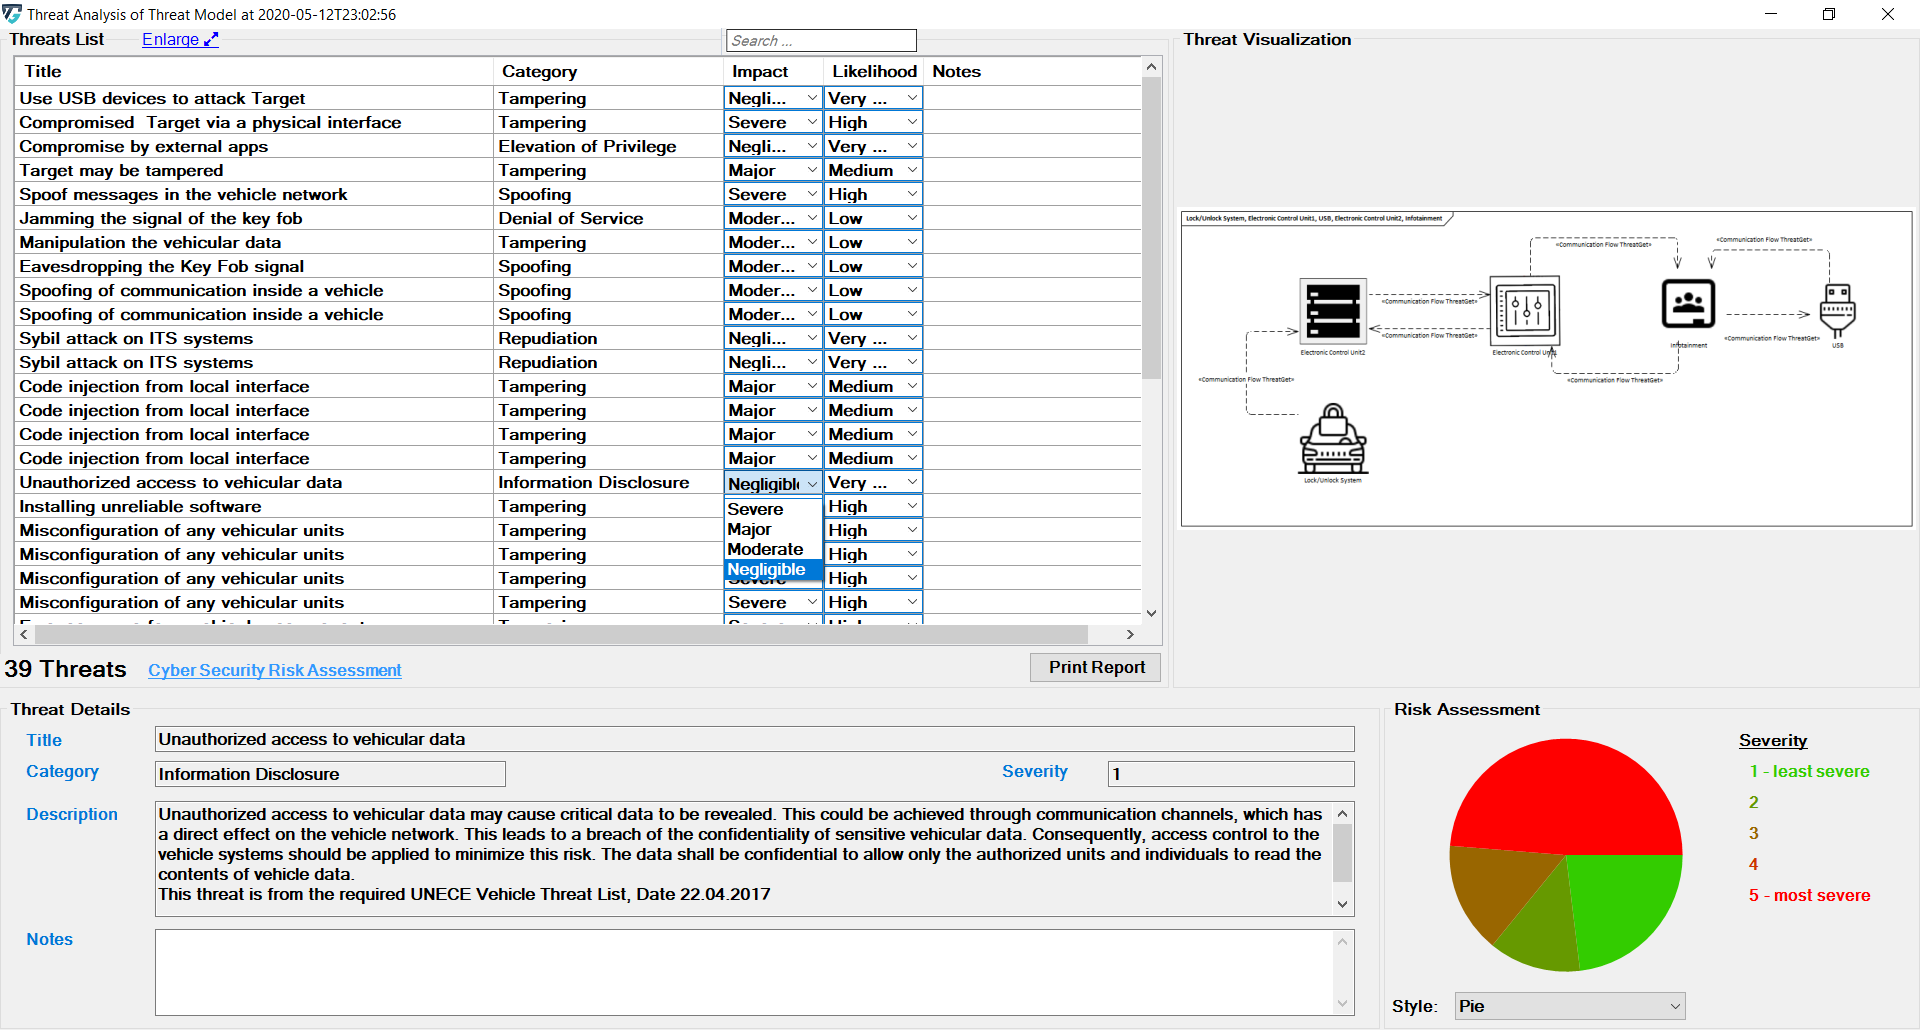
The change immediately affects the severity displayed below.
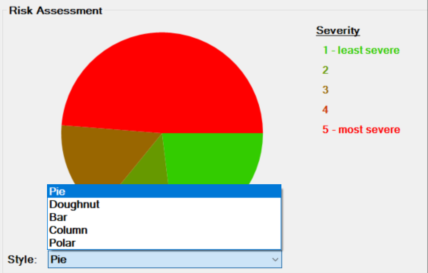
It further affects the chart on the bottom right side of the screen. Five chart styles are available for representing the distribution of threats based on the Severity of the Risk, as shown below.
It is also possible to enter notes about the analysis. This makes it possible to save individual information for later. This information is entered either in the field below the description or in the rightmost column of the analysis.
With each threat, the user can write comments in order to provide a more informative threat description; but only the first line of the user's note will be displayed at the note column in the theart table list.
However, in the note area (i.e., bottom note field), the other lines of the user's note will be stored.
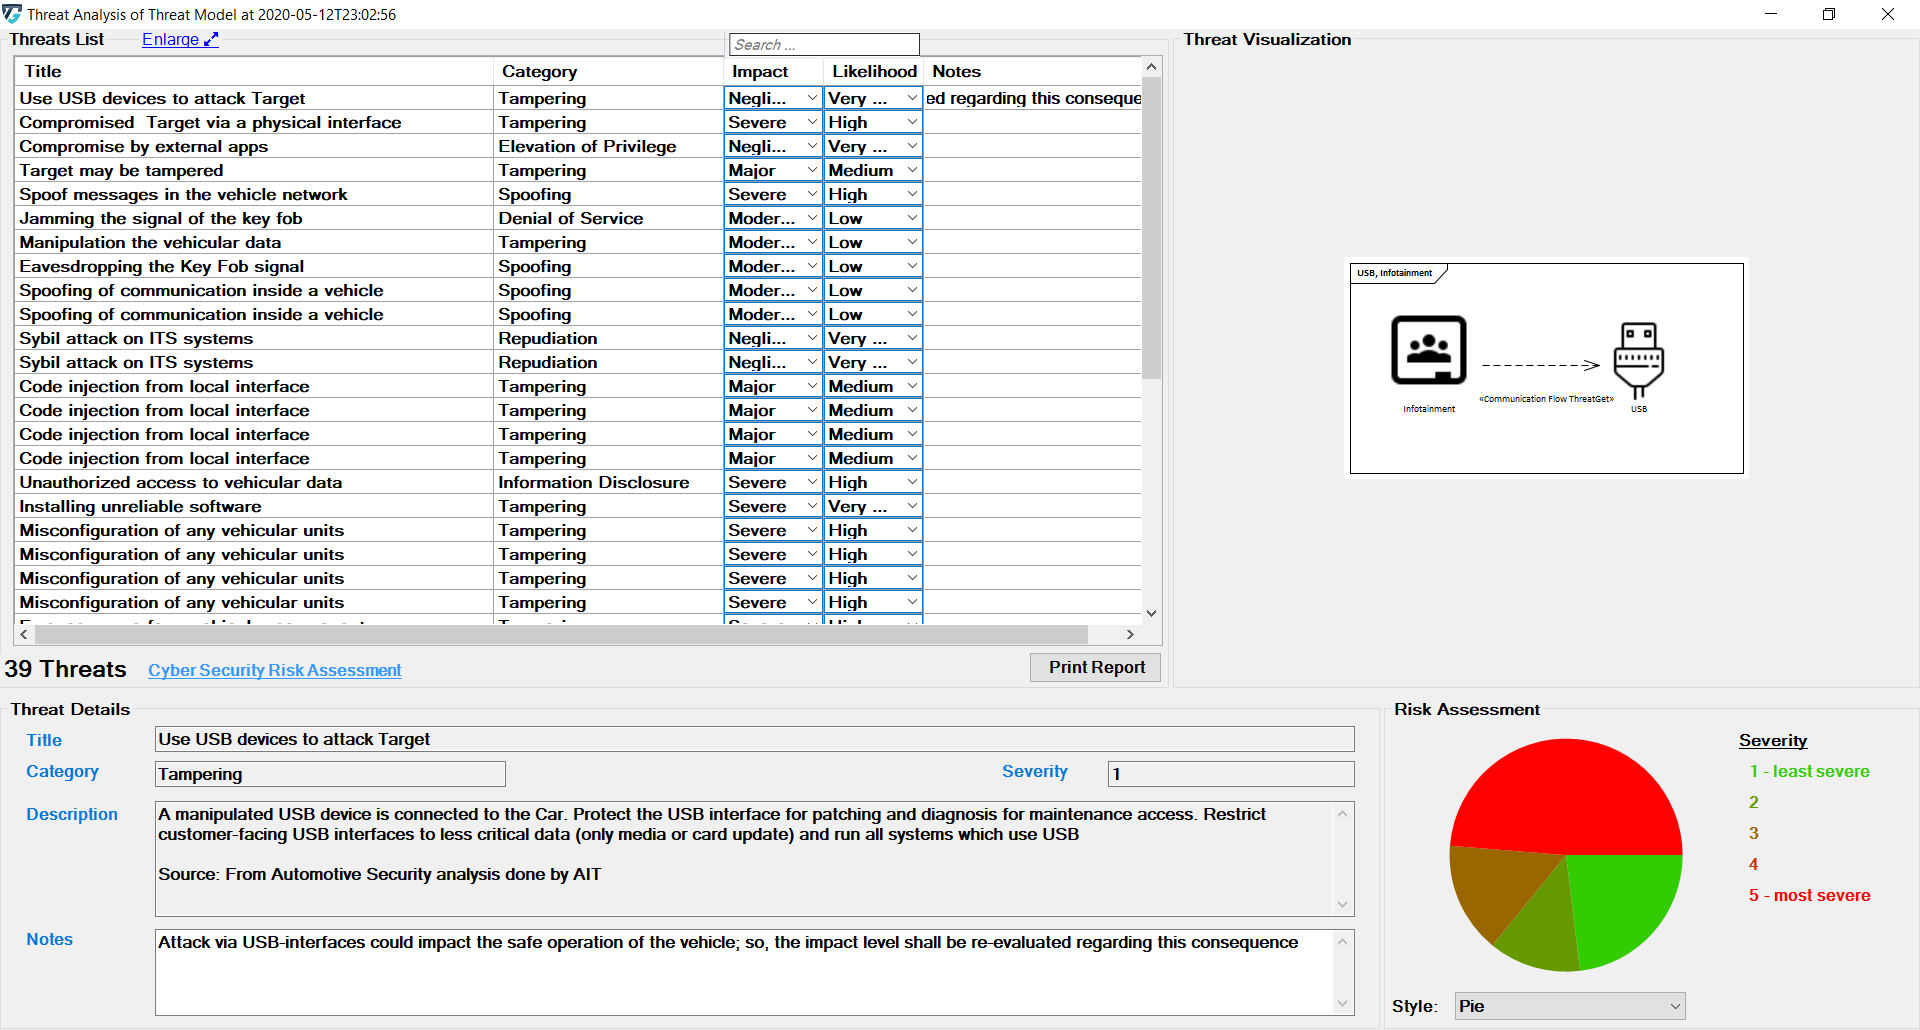
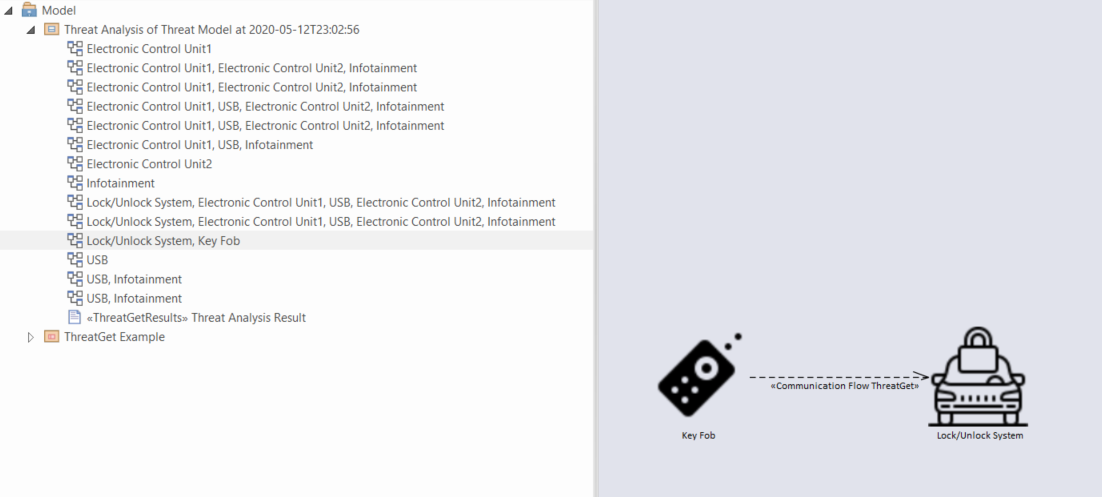
The diagrams on the right are also available in the analysis package.
Threats corresponding to each communication flow can be viewed by expanding the subpackage in the Threat Analysis package in the Project Browser. The diagram below represents the threats corresponding to communication flow Key Fob to Lock/Unlock antenna. Similarly, threats corresponding to any communication flow in the project browser can be viewed.
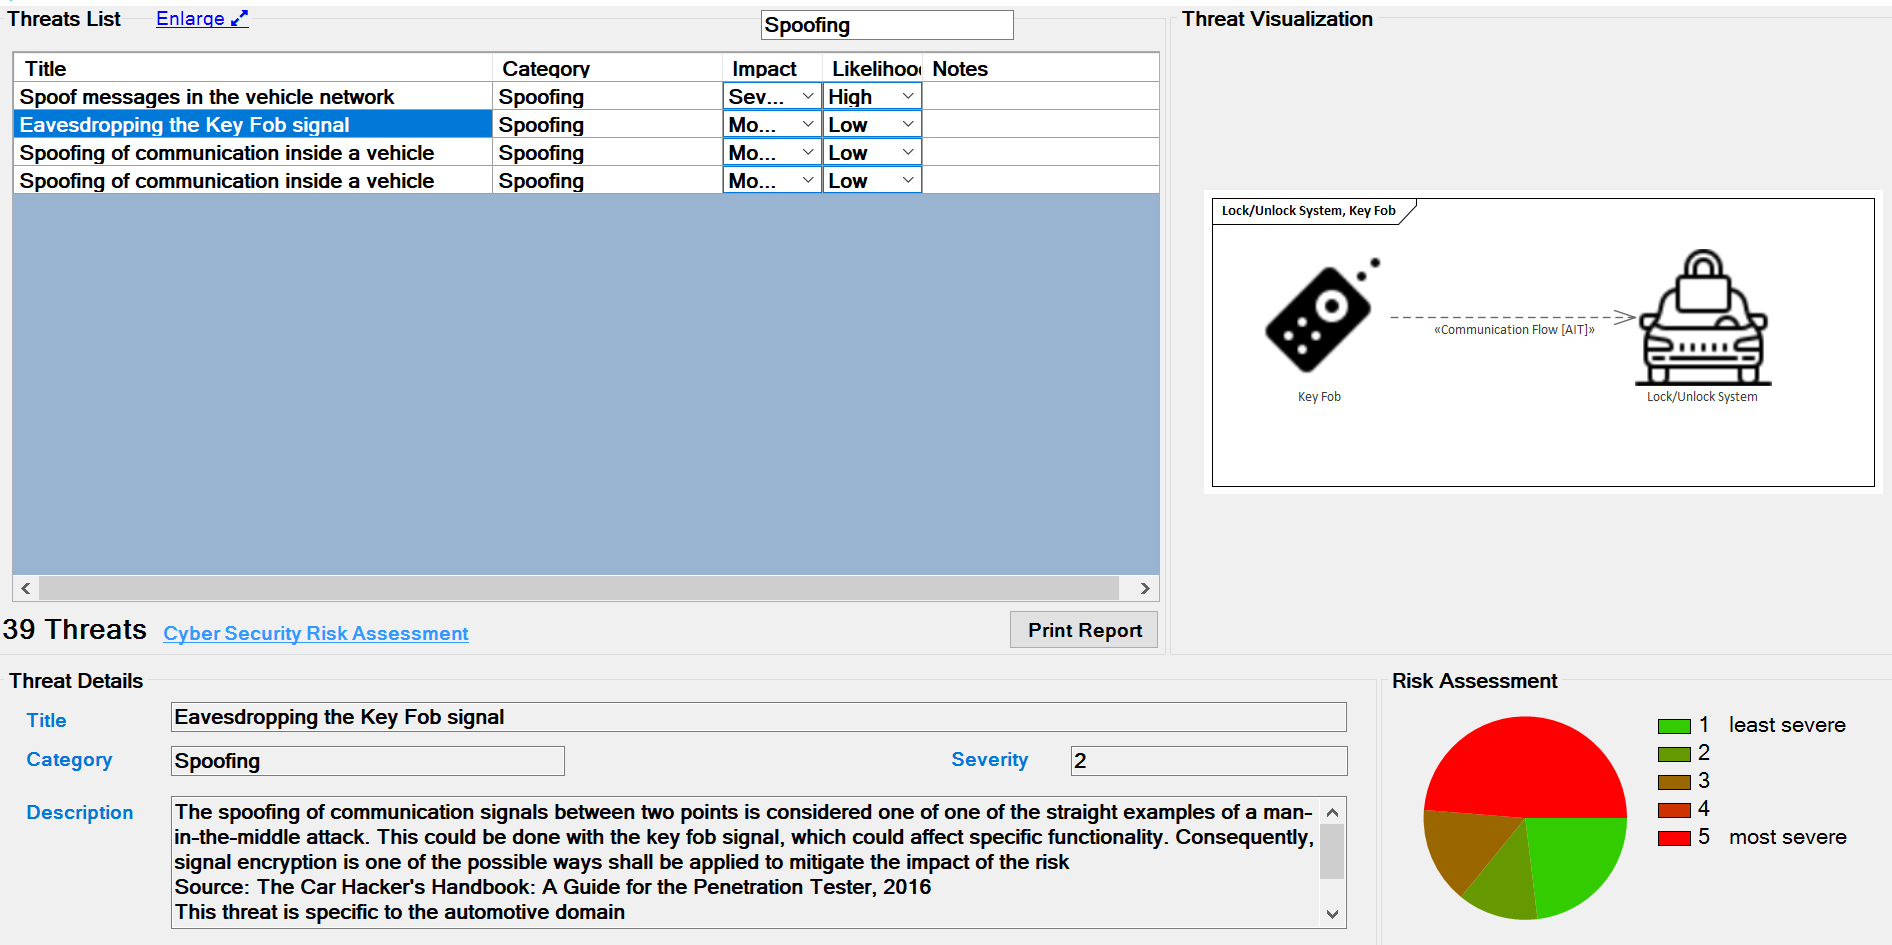
You can also use the ThreatGet search function to easily search through the results. The input is then used to filter the threat table.
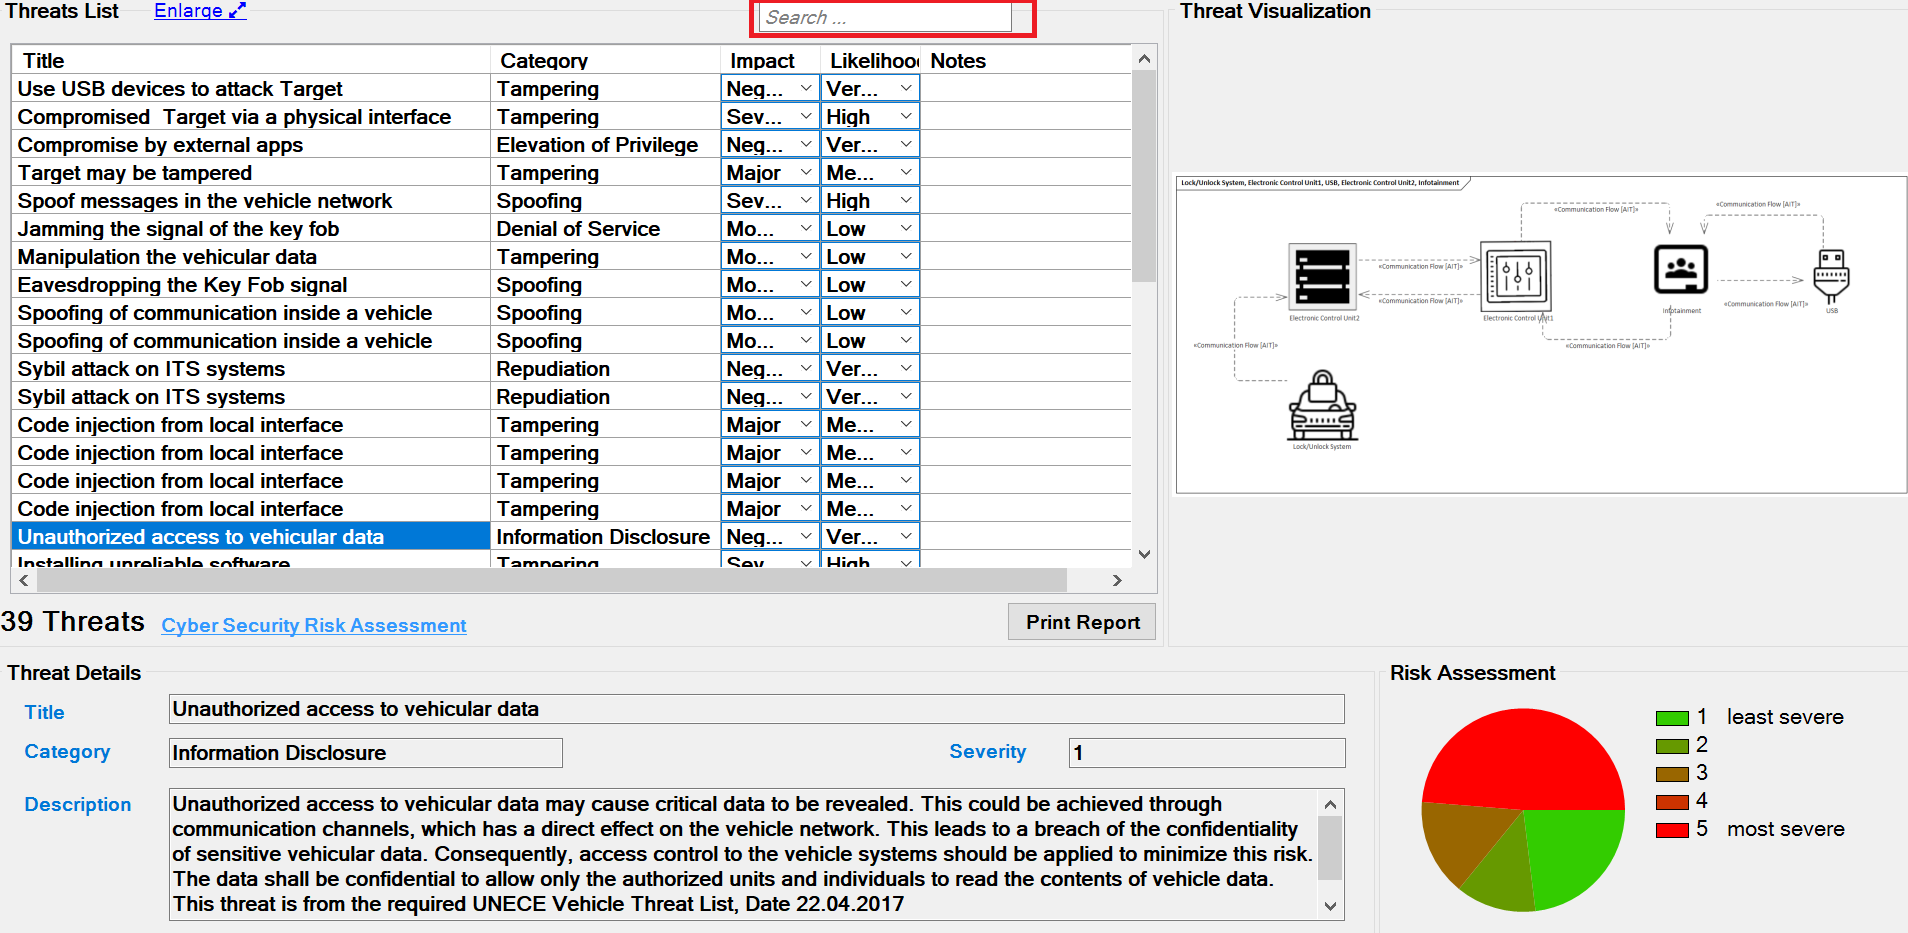
The search searches the title, category, impact, likelihood, description, and notes of each threat.
For example, we are searching for "spoofing." The results are all threats are part of this category, as shown below.
Finally we can print a report of the generated threats.